Welcome to Pathomx’s documentation
Pathomx is a workflow-based tool for the analysis and visualisation of experimental data. Initially created as a tool for metabolomic data analysis is has been extended and can now be used for any scientific and non-scientific data analysis.
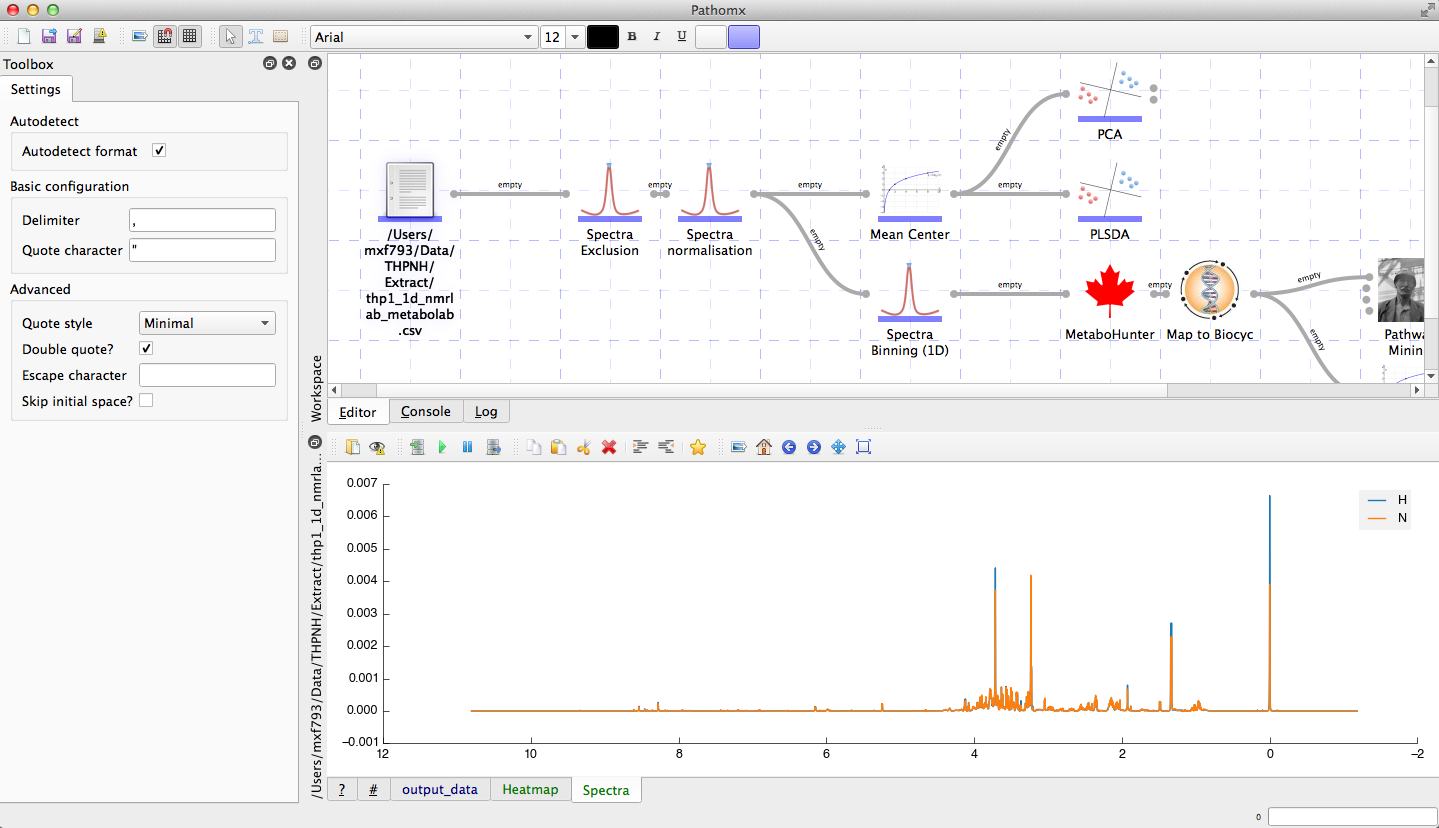
The software functions as a hybrid of workflow and script-based approaches to analysis. Using workflows it is possible to construct rapid, reproducible analysis constructs for experimental data. By combining this with custom inline scripting it is possible to perform any analysis imaginable. Workflows can be dynamically re-arranged to test different approaches and saved to track the development of your approach. Saved workflows can also be shared with other users or groups, allowing instant reproduction of results and methods. Tools can export images as publication-ready high resolution images in common formats.
This documentation contains useful information, demos and tips for the use of Pathomx by both users and developers.
Developers
Below is documentation for core/plugin developers, including documentation on how to set up a developer installation and create custom tools. API documentation is provided but is currently a work in progress documentation is added to the source code. Improvements are welcomed as pull-requests on Github.