Creating Custom Tools
This is a brief guide to creating custom tools within Pathomx. This will become easier in the future. However, if you need to create a custom tool now this is the way to do it.
Do I need a custom tool?
Custom tools allow you to access the full capabilities of the Pathomx software. The goal of a custom tool will be to create a reusable component that you can use, re-use and share with other users of the software (preferably by adding it to the main repository). In particular they give you access to -
- Tool configuration including widgets (control panels) and defaults
- Define custom plots + plot types
You don’t need to create a custom tool if you just want to -
- Do some custom scripting
- Do a one-off custom plot
- Do a one-off anything
For those type of things you’re better off just using the built-in custom script tool.
What do I need to get started?
Any standard installation of Pathomx will be OK. If you are using Python packages not in the standard installation you may need to use either the developer installation or add custom Python path definitions to Pathomx. But to learn the basics it’s best to stick to exploring with NumPy, SciPy and Pandas.
The tool stub
All tools follow a basic structure we’re going to call the tool stub. To get started on custom tool, simply download the tool stub to your local machine. Unzip the file somewhere convenient, preferably in a specific folder for custom Pathomx tools. You should end up with the following folder structure:
- <root>
- .pathomx-plugin
- __init__.py
- loader.py
- stub.py
- stub.md
- icon.png
A brief description of each follows -
.pathomx-plugin indicates that this folder is a Pathomx plugin folder. It also holds some
metadata about the plugin in the Yapsy plugin format. However, you don’t need to know about
that to use it just make your changes to the example provided.
__init__.py is an empty file required by Python to import the folder as a module. Leave empty.
loader.py contains the code required to initialise the plugin and start up. You can also
define config panels, dialogs and custom views (figure plots, etc.) in this file.
stub.py contains the actual code for the tool that will run on the IPython kernel.
stub.md contains the descriptive text in Markdown format.
icon.png is the default icon for all tools in this plugin. You can add other icons and define them
specifically on a per-tool basis if you require.
You can have more than one tool per plugin using the same loader to initialise them all. This is useful when you have a number of tools that are conceptually related. This is seen in the standard ‘Spectra’ toolkit that offers a number of tools for dealing with frequency data.
Customising the stub
To create your custom tool start with the stub file and customise from there. For this demo we’ll create a custom tool that randomly reorders and drops data on each iteration. We’ll call it ‘Gremlin’.
Open up the .pathomx-plugin file and edit the metadata. The only line
you have to edit is Name but feel free to edit the other data to match.
Do not change the Module line as this is needed to load the tool. Next
rename stub.md and stub.py to gremlin.md and gremlin.py
respectively. Then open up loader.py in a suitable text editor. We’re
going to add some features to the Gremlin tool to show how it is done.
In the loader.py file you will find the following:
class StubTool(GenericTool):
    name = "Stub"
    shortname = 'stub'

    def __init__(self, *args, **kwargs):
        super(StubTool, self).__init__(*args, **kwargs)

        self.config.set_defaults({
        })

        self.data.add_input('input_data')  # Add input slot
        self.data.add_output('output_data')  # Add output slot

class Stub(ProcessingPlugin):

    def __init__(self, *args, **kwargs):
        super(Stub, self).__init__(*args, **kwargs)
        self.register_tool_launcher(StubTool)
There are two parts to the tool. The StubTool class that defines the tool
and configures set up, etc. and the Stub loader which handles
registration of the launcher for creating new instances of the tool. You
can define as many tools in this file as you want (give them unique names)
and register them in the same Stub class __init__.
The name of the tool is defined by the name parameter to the tool definition.
If none is supplied the tool will take the name of the plugin by default.
The shortname defines the name of the files that source code and information
text are loaded from e.g. stub.py and stub.md. So change the shortname value
to gremlin and the name to Gremlin.
Below is this is the default config definition. Here you can set default
values for any configuration parameters using standard Python dictionary syntax.
We’ll add a parameter evilness that defines how much damage the gremlin
does to your data, and gremlin_type that defines what it does. Edit the self.config definition to:
self.config.set_defaults({
'gremlin_type': 1,
'evilness': 1,
})
We’ve defined the parameters and given them both a default value of 1. These will
now be available from within the run kernel as config['evilness'] and
config['gremlin_type'].
Below the config definition there are two lines defining the input and output ports
of the tool respectively. You can name them anything you like as long as
you follow standard Python variable naming conventions. Data will be passed
into the run kernel using these names. They are defined as input_data and
output_data by default and that is enough for our gremlin tool.
How to train your Gremlin
The runnable source code for tools is stored in a file named <shortname>.py in standard Python script style. We’ve already renamed stub.py to gremlin.py so you can open that now. In it you’ll find:
import pandas as pd
import numpy as np
import scipy as sp

# This is your stub source file. Add your code here!
That does not a lot. The first three lines simply import a set of standard libraries for working with data: Pandas, NumPy and SciPy. You might not need them all but it’s worth keeping them available for now. To start our custom tool we need to add some code to mess up the data. First we need a copy of the input_data to output, then we want to mess it up. Add the following code to the file:
import pandas as pd
import numpy as np
import scipy as sp

# This is your stub source file. Add your code here!

from random import randint, choice

# Define the gremlin types, these must be matched in the
# loader config definition
GREMLIN_RANDOM = 1
GREMLIN_DELETE_ROW = 2
GREMLIN_DELETE_COLUMN = 3
GREMLIN_RANDOM_ROWS = 4
GREMLIN_RANDOM_COLUMNS = 5

output_data = input_data

# Repeat the gremlin action 'evilness' times
for n in range( config['evilness'] ):

    if config['gremlin_type'] == GREMLIN_RANDOM:
        gremlin_type = randint(1,5)
    else:
        gremlin_type = config['gremlin_type']

    if gremlin_type == GREMLIN_DELETE_ROW:
        # Delete random row(s) in the pandas dataframe
        output_data.drop( choice( output_data.columns ), axis=1, inplace=True )

    elif gremlin_type == GREMLIN_DELETE_COLUMN:
        # Delete random column(s) in the pandas dataframe
        output_data.drop( choice( output_data.index ), inplace=True )

    elif gremlin_type == GREMLIN_RANDOM_ROWS:
        # Randomly switch two rows' data
        if output_data.shape[0] < 2:
            raise Exception('Need at least 2 rows of data to switch')

        i1 = randint(0, output_data.shape[0]-1)
        i2 = randint(0, output_data.shape[0]-1)

        output_data.iloc[i1,:], output_data.iloc[i2,:] = output_data.iloc[i2,:], output_data.iloc[i1,:]


    elif gremlin_type == GREMLIN_RANDOM_COLUMNS:
        # Randomly switch two columns' data
        if output_data.shape[0] < 2:
            raise Exception('Need at least 2 columns of data to switch')

        i1 = randint(0, output_data.shape[0]-1)
        i2 = randint(0, output_data.shape[1]-1)

        output_data.iloc[:,i1], output_data.iloc[:,i2] = output_data.iloc[:,i2], output_data.iloc[:,i1]


# Generate simple result figure (using pathomx libs)
from pathomx.figures import spectra

View = spectra(output_data, styles=styles);
This is the main guts of our gremlin. A copy of the input_data is made to output_data
and then a simple loop iterates evilness times while performing
some or other task on the output_data. The choice of actions are: delete row,
delete column, switch two rows, switch two columns. An option is available to make a
random selection from these transformations. Setting evilness to 10 and gremlin_type
to 1 will perform 100 random operations on the data. Enough to drive anyone quite mad.
Finally, we use built in standard figure plotting tools to output a view of the transformed data.
Initial test
To see what damage the gremlin can do we need a set of data to work with. Download the sample dataset, a set of processed 2D JRES NMR data with class assignments already applied.
Start up Pathomx as normal. Before we can use our Gremlin tool we’ll need to tell Pathomx where to find it so it can be loaded. On the main toolbar select “Plugins” then “Manage plugins...” to get to the plugin management view. Here you can activate and deactivate different plugins and add/remove them from the Toolkit view. To find the Gremlin tool we’ll need to tell Pathomx about the folder it is in.
Add the folder containing the Gremlin tool, or alternatively a parent folder if you want to create more tools in the same place. Pathomx will automatically search through the entire tree to find plugins so it’s probably best not to add an entire drive.
Once added the plugin list will refresh and be listed (and automatically activated) in the plugin list. You can now close the plugin management list and see that your new tool is ready and waiting in the Toolkit viewer. It will be there every time you run Pathomx.
Drag it into the workspace and click on it. You’ll notice that there isn’t much to see: there is no configuration UI defined and we haven’t updated the about text. But it’s still a fully-operational gremlin. So let’s see it in action.
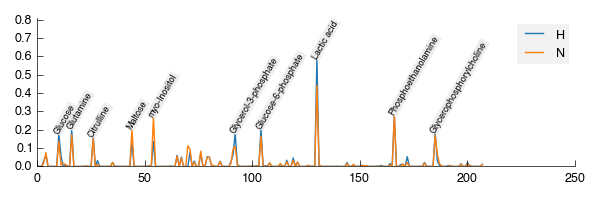
Drag an Import Text/CSV tool into the workspace and select it. Using the open file widget select the file you downloaded earlier containing the demo dataset. Have a look at the Spectra view output to see how it should look.
Now drag from the Import Text/CSV output_data` port to the Gremlin ``input_data port.
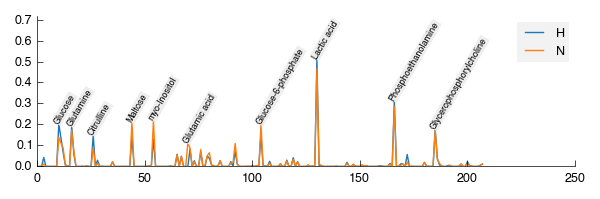
The gremlin tool will automatically calculate using the new data and display a modified plot
called ‘View’. If you can’t see the different between this and the earlier plot try pressing
the green play button a few times to re-run the tool. You will see the data change each
time.
Adding configuration
A tool is not a lot of use without the ability to control it. All tools can be modified by editing the source directly (see the # tab) but that isn’t particular convenient. Pathomx tools can define configuration panels, containing multiple widgets that are linked to the defined config settings.
Add the following code to the loader.py file.
# Configuration settings for the Gremlin
class GremlinConfigPanel(ConfigPanel):

    def __init__(self, *args, **kwargs):
        super(GremlinConfigPanel, self).__init__(*args, **kwargs)

        gd = QGridLayout()

        choices = {
            'Random': 1,
            'Delete row': 2,
            'Delete column': 3,
            'Randomise rows': 4,
            'Randomise columns': 5,
        }

        gremlin_type_cb = QComboBox()
        gremlin_type_cb.addItems( choices.keys() )
        self.config.add_handler('gremlin_type', gremlin_type_cb, choices)
        gd.addWidget( QLabel('Gremlin type'), 0, 0)
        gd.addWidget(gremlin_type_cb, 0, 1)

        evilness_sb = QSpinBox()
        self.config.add_handler('evilness', evilness_sb)
        gd.addWidget( QLabel('Evilness'), 1, 0)
        gd.addWidget(evilness_sb, 1, 1)

        self.layout.addLayout(gd)

        self.finalise()
This block of code defines the configuration panel for the tool. This is done using standard Qt (PyQt) widgets and layout code, which won’t be gone into detail here. However, the bits unique to Pathomx tool code are worth a bit of explanation:
As previously described tools have an in-built config handler (based on the pyqtconfig package
available on PyPi). This keeps track of settings and also allows widgets to be attached and
automatically synced with configuration settings. This is achieved with self.config.add_handler linee.
The first parameter is the config key to set, the second the widget and the (optional) third is a
mapping dictionary/lambda tuple that converts between the displayed and stored value.
This is used for the drop-down so that when Random is displayed, the stored value in
the config is actually 1. These mappings can be applied to any widget and can apply any transformation
required. The widget is synced to the config value as it is bound.
Each ConfigPanel has a default layout object defined to which
your widgets are attached. They can be placed directly using self.layout.addWidget(widget)
or, as above, by defining a new layout and assigning that. It’s usually useful to use a GridLayout
to place widgets on the panel alongside labels.
Finally, the self.finalise() call is required to apply the layouts and wrap up the initialisation.
Next, add the following line to the __init__ function of the GremlinTool class:
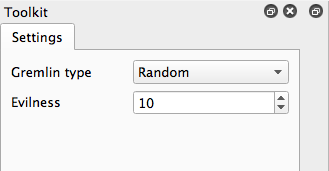
self.addConfigPanel(GremlinConfigPanel, 'Settings')
...and you’re good to go. Restart Pathomx and the Gremlin tool will auto-reload automatically. Drag the tool into the workspace and then select it. On the left hand side you should see your shiny new control panel. Connect the tool up with the sample data as before, and then experiment with the config settings to see the effect.
Since we output the result of the transformation via the output_data port you can also
connect up other tools and see the effect there. For example, connect up a PCA or PLS-DA
tool and see the effect that the gremlin has on the ability of those algorithms to
separate the two classes in the dataset.
Polish
Open up the gremlin.md file and edit the file to say whatever you would like it to. You can
also replace the icon.png with a PNG format image more appropriate to an evil gremlin tool.
The end
This doesn’t cover everything that is possible within a custom tool, but it should give you enough to get started on your own. If you have any suggestions for improvements of this documentation or want to share your own demos, get in touch.
The complete Gremlin tool is available for download.