Welcome to Pathomx’s documentation
Pathomx is a workflow-based tool for the analysis of metabolic pathways and visualisation of associated experimental data.
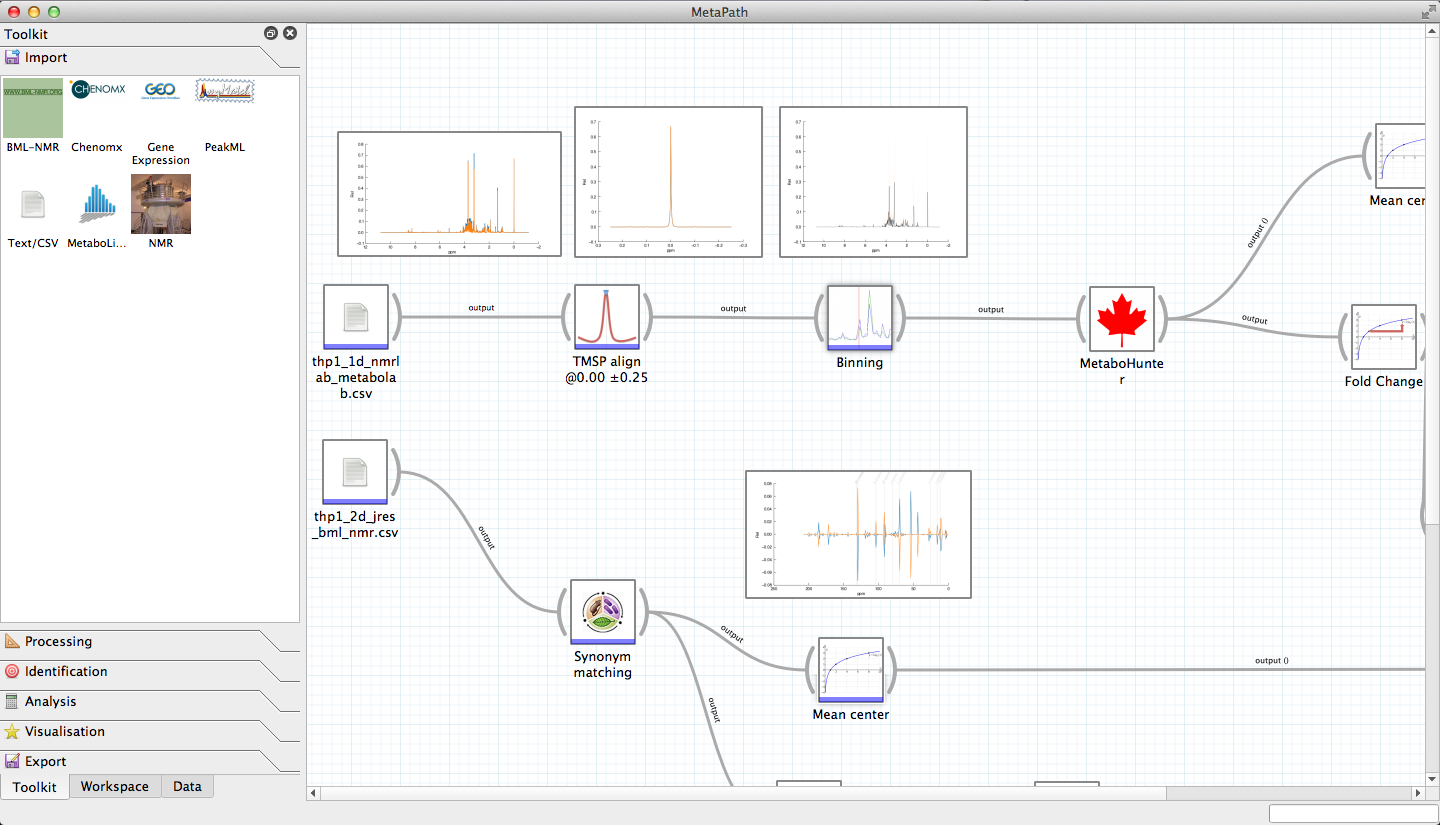
Workflow based data exploration: Workflows can be created, edited and shared using the built-in analysis workflow editor. Set up standardised analysis approaches and apply them to new data consistently. Add-remove tools to test different approaches, and re-apply tried and tested methods to new data.
Metabolic pathway exploration: Browse through the metabolic pathway database, with automated clean rendering of pathways. Add and remove metabolic pathways, show intra-pathway linkages, and map metabolic routes through the system. Browse the in-built database, following links to online resources for further information.
Metabolic data visualisation: Load experimental data gathered by mass-spectroscopy (MS) or nuclear magnetic resonance (NMR) spectroscopy and visualise metabolic changes overlaid on a a map of the sytem. Visualise gene-expression or protein quantity data alongside to explore relationships between enzyme regulation and metabolic processes. Use the built-in “Pathway Mining” tools to select the most up, down, or overall regulated pathways in the given system to identify the key mechanisms at work.
Users
More documentation is coming soon, in the meantime there are demos available on the Pathomx website here.
Developers
Below is API documentation for core/plugin developers. This is a work in progress as documentation is added to the source code. You can submit patches via github.